Marketing requires investing a lot of time and analyzing all the data. This whole process would be pointless if there is no proper way to track all the data and visualize it. The most applicable technique for solving this problem that marketing experts find themselves with is so-called marketing dashboards.
Do you want to keep an eye on your #marketing #process? These marketing #dashboard tools are the perfect choice for you!
Some tools display marketing analysis, KPIs, and other measurable data using visualization. They also offer the ability to update data in real-time, which further enables the analysis process. Below we have prepared some more information about these tools, and we will also introduce you to some of the best marketing dashboards out there that can help you.
Why Are Marketing Dashboards Useful?
Marketing dashboards are the ones that can provide metrics for your current campaigns along with pageview rates or total visits. It helps to customize the dashboard to your preferences, to monitor the advertising campaign process, etc.
The software contained in these tools helps manage and understand the information of your marketing processes. Your dashboard should also report on a daily, weekly, or monthly level of data tracking.
Within these dashboards, you can manipulate data and present it through visuals and graphs to have a more precise and better understanding of the results obtained. If the dashboard is easy to read, that means you have secure data. Also, if data is flexible and provides timely information, you know you have the right tool in your hands.
This marketing element aims to statistically present key performance indicators to make the most accurate decisions based on adequate information.
Further, we will tell you more about each tool we consider deserves a spot on our top 5 list!
Tableau
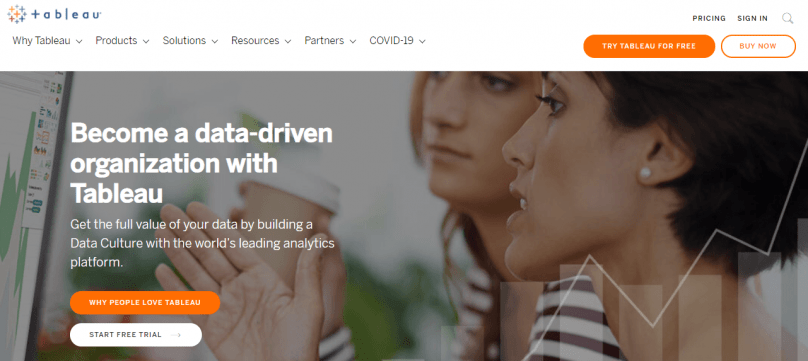
Tableau is software designed for dashboards that provides clear visualization of data in a single program. The software provides secure data management with detailed analysis creating a suitable data-based environment. Also, you can use a powerful tool like Tableau to prepare reports for advanced analytics.
The advantage of this tool is that its work is based on scientists’ research to provide you with the possibility of faster and easier analysis. Given its extensive network of long-standing partnerships, this tool can integrate many programs from GitHub to Spotify.
In conclusion, we have to mention that Tableau is one of the most modern tools in business intelligence that offers faster discovery and sharing of insights in the business world.
Zoho Analytics
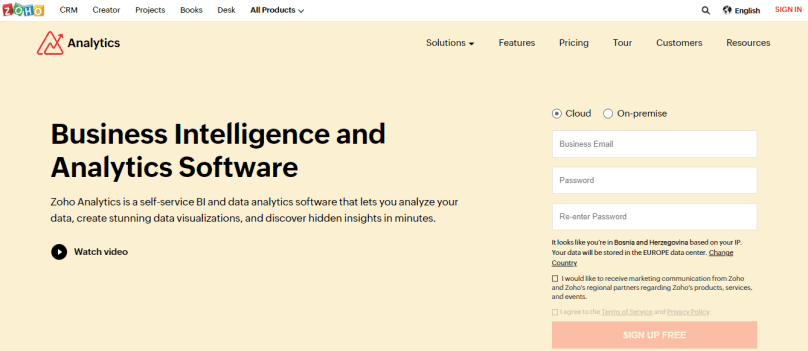
This paragraph brings you another software designed for data analysis and linked to any data source and reporting and analysis tools is Zoho Analytics. The visualization is very pleasing to the eye and readable, and it is possible to display it via mobile devices designed for iOS and Android systems. Integration is possible with many different programs, including Salesforce, MailChimp, SurveyMonkey, Facebook, YouTube, Shopify, Google Analytics, etc.
This platform is designed to use it yourself by simply dragging and dropping data from dashboards. Simple, isn’t it? You can find Zoho in the free 15-day version and try the mentioned and other benefits, and if you opt for alternatives, it will require additional costs.
Grow
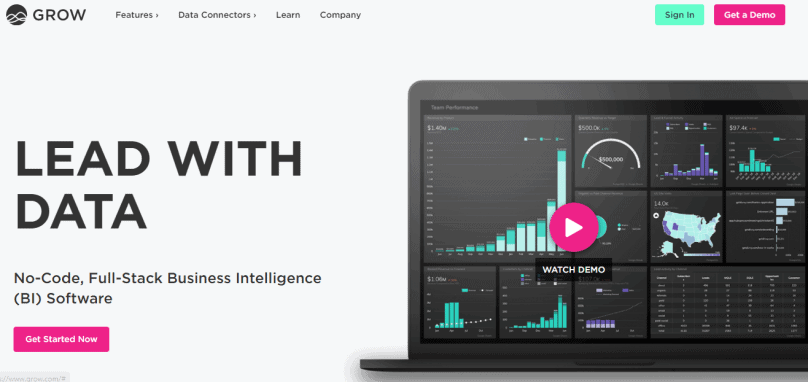
A platform called Grow provides access to powerful dashboards with the ability to report data in real-time. Grow can automatically retrieve data from dashboards to make reporting more complete and accurate. It is designed so that analytics is available to all employees of a particular company.
However, this is possible without the necessary advanced knowledge and experience in technological fields. It is effortless to use so that each person can learn to analyze the data obtained. This tool’s essential benefits are its focus on growth and collaboration with advanced data transformation and visualization.
Whatagraph
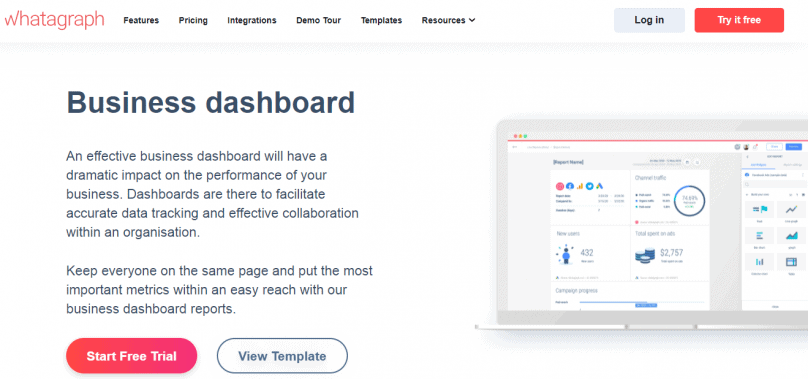
The following exciting platform is Whatagraph. This tool provides multi-channel data reporting, merging with accounts or campaigns for a clear overview of all processes. The important detail that we have to mention is that it allows for clients with access to reports at any time.
Moreover, you can also customize the colors, logos, or domains in posts with custom data. Even if you’re short on ideas, you can always take advantage of pre-created report suggestions. The detail that attracts many users is the aesthetically modern look of the easy-to-read and understand reports. And there is no end to integration – it is possible to connect to over 30 different programs.
The only objection is that the use of the platform requires the allocation of a large amount of money monthly, except for a trial period of 7 days. However, we do think it is worth at least giving it a shot.
ActiveDEMAND
This marketing platform is customizable and offers many benefits. It is an integrated platform for marketing automation intended for digital marketing agencies (B2B). ActiveDEMAND saves time when tracking results and providing more accurate and precise reports with timely reporting from dashboards.
What sets it apart from the rest is the comprehensive call tracking module, with the added option of call tracking, CallForensics, and many more other options. Dashboards can be created for social media or email to perform a more detailed analysis of company data.
Lastly, the price of the tool and package varies according to the agency’s needs. Take a look at the packages and find the one that suits you!
Conclusion
In conclusion, using dashboards for marketing purposes is very important and holistic, as it can save you a lot of time in the first place. All data is updated in real-time with easy analysis and visualization.
Our recommendation is to try a combination of different marketing software using trial versions to know what best suits the needs of your business.
When choosing a dashboard, pay attention to ease of use, data integration capabilities, automation, and the availability of different types of reports for more accessible data analysis.