Using data visualization has become a standard in many aspects of modern life. Be it school projects, business meetings, or college lectures, knowing how to make graphs and charts coherent and easy-to-follow is an invaluable skill.
It is just as crucial to have the right #tools for #creating a successful #chart as knowing how to make one. We’ve listed the top five for you in this article.
However, choosing the right chart tool from a large selection of available tools can be difficult. For that reason, we have selected the 5+ best chart tools available online to make chart designing as easy as possible for you.
1. wpDataTables

If you have a WordPress website and you’re looking to integrate it with Google Sheets, wpDataTables is your perfect match! This plugin empowers you to effortlessly manage data and create fully customizable tables and charts.
Who says that working with tables has to be boring? Tables, charts, and data management have never been easier than with the wpDataTables plugin and its Google Sheets integration. Setting up integration is a breeze, even for users with limited technical skills. You also get an intuitive setup wizard that guides you through the entire process step by step.
What sets this Google Sheets Integration WordPress plugin apart from the rest is its extensive library of resources aimed to help you manage everything easily.
Once you integrate wpDataTables with Google Sheets, the real-time data synchronization is impressive. Any changes you make in Google Sheets are instantly available on your WordPress website. You also have full control over your data, making sure that only authorized users can see it and make changes. You can even skip certain columns or add new ones and edit the data at any point.
The true power of wpDataTables lies in the combination of basic and advanced features it offers, and how easy it is to take advantage of both. You can create charts using Creation Wizard and also group similar rows.
With an impressive number of add-ons and a fantastic feature-to-cost ratio, it’s no wonder that wpDataTables is one of the favorite Google Sheets Integration WordPress plugins.
Key Features:
- Conditional formatting
- Customizable tables
- Advanced filtering
- Making dynamic SQL Queries with placeholders
- Row Grouping
- Pre-filtering tables through URL
- Calculating totals for columns
- Scrollable
- Editor input types
- Allowing users to see and edit only their own data
Price:
Annual subscription: Starting from $55 for one domain.
Lifetime: Starting from $210 for one domain.
2. Google Charts
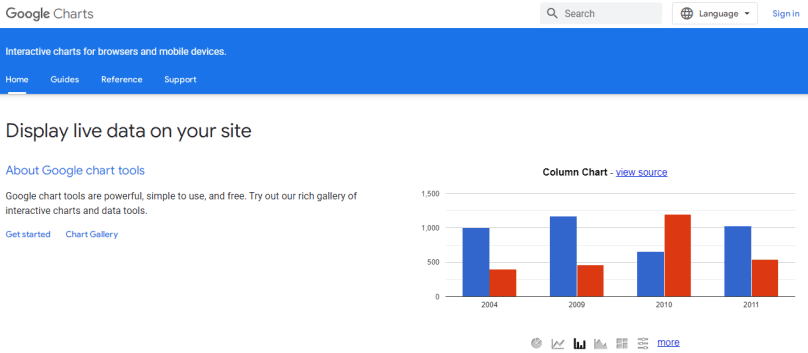
Google Charts is an entirely free option accessible to practically anyone; it has many features and is very easy to use. It provides numerous interactive chart tutorials on how to use and customize them, allowing you to personalize them.
Another great feature of this tool is the ability to connect your charts to an interactive dashboard and the option of connecting to real-time data.
3. Livegap Charts
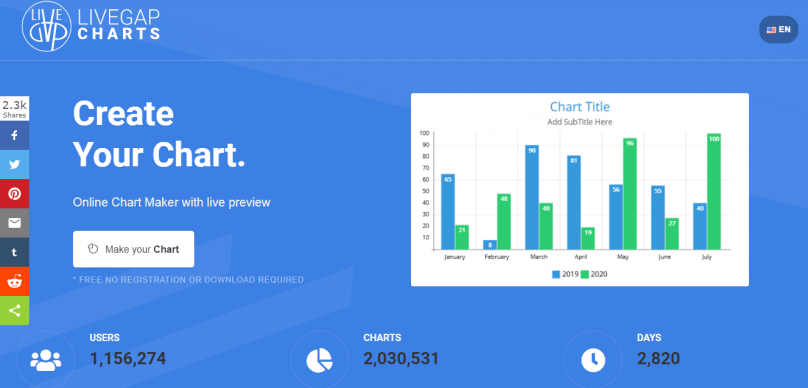
When talking about free-of-charge and high-quality chart makers, it is hard not to mention Livegap Charts. It is one of the most user-friendly chart tools, with an easy step-by-step guide that allows you to export your data from any spreadsheet and get a live preview.
Designing the charts to your liking is simple because this tool includes a plethora of chart and graph designs with fully customizable details such as background, color, legend, etc. Livegap Charts does not require any form of registration or download.
So you can start using it as soon as you click on their webpage. After you finish using it, you can save your chart as an image or web page and save it online or share it with your friends.
4. RAWGraphs
RAWGraphs has become a crowd-favorite for free and accessible chart tools that allow you to export and edit your existing spreadsheets quickly. It’s as easy as copying your current data into their web app, choosing a design and type of chart that works best for you, and your graph is ready to be exported.
RAWGraphs shows you a preview before finishing and allows you to make any changes you want. This chart tool was created with designers and subject matter experts in mind. So, in addition to your standard chart and graph types, you can find some unique chart types that you might not find in other alternative tools.
5. Visme

Visme is one of the more popular chat tools on the market that focuses on creating infographics and business charts. While it is geared toward businesses and enterprises, it also includes many essential features that make it simple to learn and use.
Visme features a massive collection of chart designs and templates packaged within an elegant customization system. The end product is easy to edit, download, or share with your friends and colleagues. Visme comes at four different price points – Free, Personal ($29/month), Business ($59/month), and Enterprise (custom pricing).
6. Gliffy
If you are looking for a user-friendly and easy-to-pick-up chart maker, look no further than Gliffy. Gliffy is a unique and handy tool that helps you create quality charts for any occasion, whether it’s a high-school lecture or a board meeting, thanks to its intuitive drag-and-drop system.
Two engineers designed it with the idea of making a very easy-to-use diagram maker that could satisfy the needs of both the inexperienced chart newbie and the seasoned designing veteran. Gliffy comes at two different pricings – Professional ($8/month – personal, $6/month – team) and Enterprise (Custom pricing).
Conclusion
Charts, graphs, and diagrams have become necessary in presenting contemporary ideas.
While creating and editing charts might seem like a tedious task, it is ultimately the best method of visual data interpretation. Choosing one of the chart makers listed above will surely help you visually convey your ideas and information more successfully.